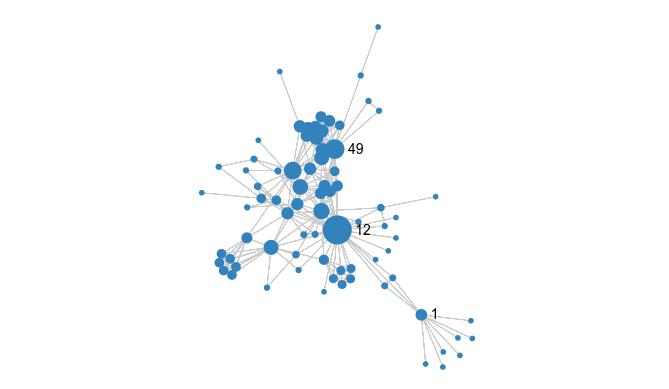
Sgraph enables to visualize graphs using the latest stable version of Sigma.js v2.4.0. Graphs are created using the igraph package.
This package uses ggplot-like grammar: a basic visualization is first created and then modified by adding/removing attributes with additional functions, using the pipe operator from the magrittr package.
The basic visualization is created with the sigma_from_igraph function, then various functions are called to control the aesthetics of the visualization, which all take a sgraph object as the first argument.
Links
© All rights reserved, Thomas Charlon, 2025.
Template by Bootstrapious. Ported to Hugo by DevCows.