Knowledge graphs enable to organize vast amounts of knowledge and has been used extensively on internet to help websites share data and integrate one another. In the domain of research and knowledge discovery, they enable to organise results and provide specific views of results by showing subsets of interest.
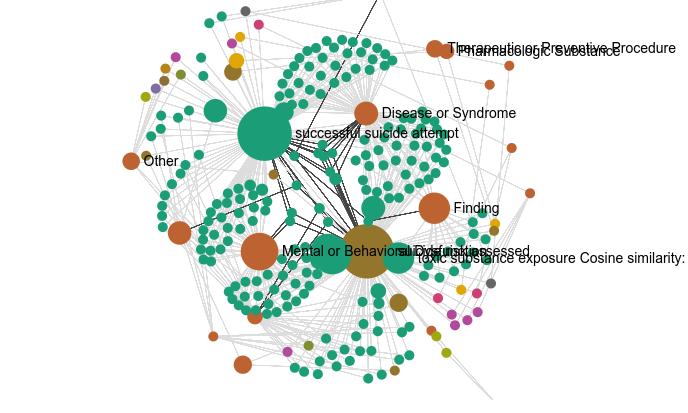
Knowledge graphs are defined by sets of nodes in relationships to each other (and in the contexts of graphs, relationships between nodes can be called edges). Both nodes and edges can be of different types and one commonly used type of relationship is “parent-child”, e.g. in the context of mental health, one such relationship could be: schizophrenia “is a” mental health disorder. This is an example of a directed relationship, and examples of undirected relationships include pair-wise similarities as cosine.
The ‘kgraph’ package provides the ability to easily build knowledge graphs and feed them for visualization to the ‘sgraph’ package. The ‘kgraph’ package focuses on building the complex graphs that arise when we build knowledge graphs, with a particular focus on clinical and biomedical data, although the methods aim to be general enough for use in any application. The ‘sgraph’ package focuses on interfacing the Sigma.JS library and performs minimal computation.
There are three main computations performed by the ‘kgraph’ package:
- Building a knowledge graph using specified relationships and edges
- Determining a similarity threshold from a complete pair-wise similarity matrix or from an embedding matrix
- Measuring the performance of a prediction model using known pairs
Links
© All rights reserved, Thomas Charlon, 2025.
Template by Bootstrapious. Ported to Hugo by DevCows.